Assorted topics
Chart.js API
- API
For each chart, there are a set of global prototype methods on the shared chart type which you may find useful. These are available on all charts created with Chart.js, but for the examples, let’s use a line chart we’ve made.
// For example:
   var myLineChart = new Chart(ctx, config);
- destroy()
Use this to destroy any chart instances that are created. This will clean up any references stored to the chart object within Chart.js, along with any associated event listeners attached by Chart.js. This must be called before the canvas is reused for a new chart.
// Destroys a specific chart instance myLineChart.destroy();
- update(mode?)
Triggers an update of the chart. This can be safely called after updating the data object. This will update all scales, legends, and then re-render the chart.
myLineChart.data.datasets[0].data[2] = 50;
// Would update the first dataset’s value of ‘March’ to be 50 myLineChart.update();
// Calling update now animates the position of March from 90 to 50.
A mode string can be provided to indicate transition configuration should be used. Core calls this method using any of ‘active’, ‘hide’, ‘reset’, ‘resize’, ‘show’ or undefined. ‘none’ is also a supported mode for skipping animations for single update. Please see animations docs for more details.
Example:
myChart.update('active');
- reset()
Reset the chart to its state before the initial animation. A new animation can then be triggered using update.
myLineChart.reset();
-
render()
Triggers a redraw of all chart elements. Note, this does not update elements for new data. Use .update() in that case. -
Static: getChart(key) Finds the chart instance from the given key. If the key is a string, it is interpreted as the ID of the Canvas node for the Chart. The key can also be a CanvasRenderingContext2D or an HTMLDOMElement. This will return undefined if no Chart is found. To be found, the chart must have previously been created.
const chart = Chart.getChart("canvas-id");
Chart.js
- creat chart

#Contributing Before submitting an issue or a pull request to the project, please take a moment to look over the contributing guidelines first.
For support using Chart.js, please post questions with the chartjs tag on Stack Overflow .
#License Chart.js is available under the MIT license .
Documentation is copyright © 2014-2021 Chart.js contributors.
The source
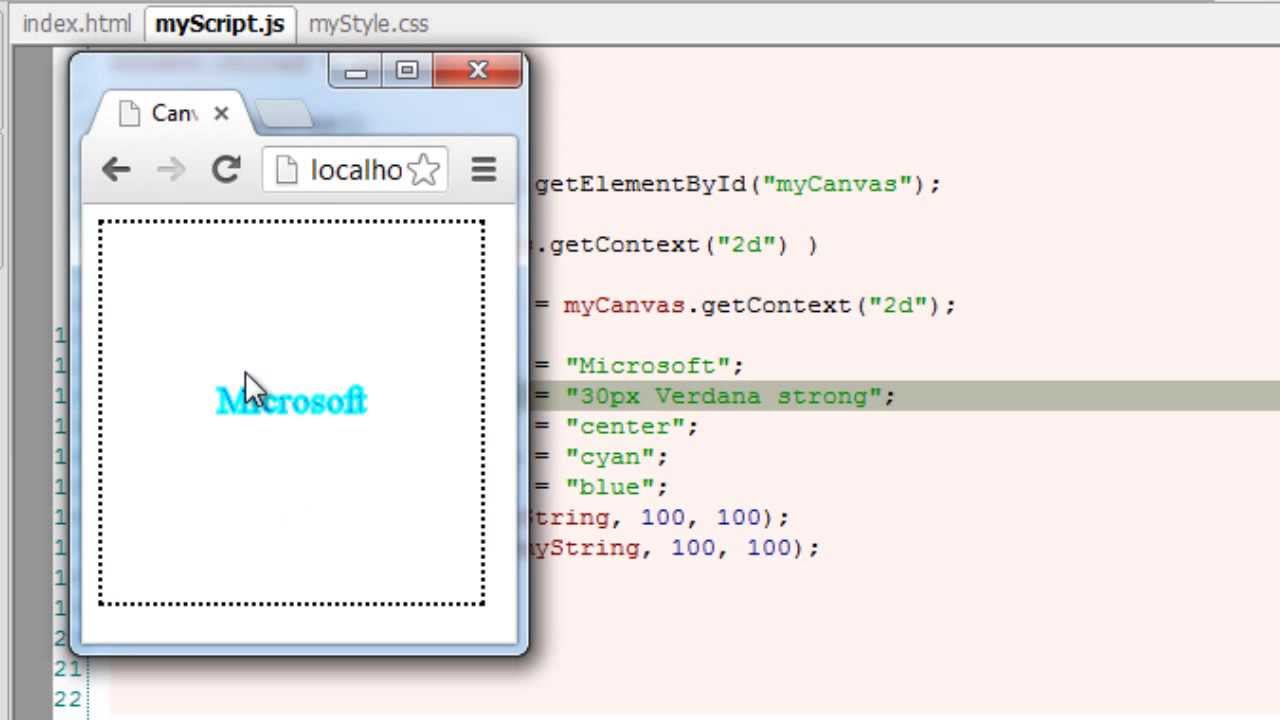
Canvas API
The Canvas API provides a means for drawing graphics via JavaScript and the HTML
The Canvas API largely focuses on 2D graphics. The WebGL API, which also uses the
Basic example This simple example draws a green rectangle onto a canvas.
- HTML
<canvas id="canvas"></canvas> - JavaScript
The Document.getElementById()
method gets a reference to the HTML<canvas>element.
Next, theHTMLCanvasElement.getContext()method
gets that element’s context—the thing onto which the drawing will be rendered.
The actual drawing is done using the CanvasRenderingContext2D interface. The fillStyle property makes the rectangle green. The fillRect() method places its top-left corner at (10, 10), and gives it a size of 150 units wide by 100 tall.
const canvas = document.getElementById('canvas');
  const ctx = canvas.getContext('2d');
 ctx.fillStyle = 'green';
   ctx.fillRect(10, 10, 150, 100);
* Drawing shapes*

Drawing Text